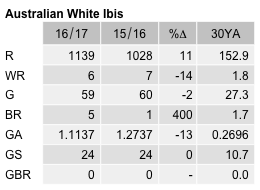
Australian White Ibis
Threskiornis moluccus
ABR description
The following is extracted from the Annual Bird Report for the twelve months to June 2017.
Common, breeding resident
A regular inhabitant of wetlands around the region.
General: Numbers increased rapidly in recent years: current numbers up 14% on 2016, 10x 30YA. Reporting rate, 8.1%, down from 8.8%, but remains well above long-term averages. This year sightings were distributed more evenly across the seasons, with fewer sightings (23% cf 34% 30YA) in spring. Max 440/28 Jun Hannah Community Park (Fadden) (CaR3), up 6% on last year, mean 16.4, median 3. 4 breeding records: (3 on, 1 ny) compared with only 1 in 2016. Earliest breeding record: on/17 Sep and latest: on/17 Dec both at Gungahlin Pond, (RoM3). TNR only other location with a breeding record, ny/24 Sept TNR, (MeT1).
GBS: 283 records from 24 sites in 16 grid cells is very like last year. Recorded in all weeks, up 5 weeks from 2016. Overall numbers are down 23% to 2860. Max 227/3wk Jun Fadden (CaR3) (370 in 2016), mean 10.1 (13.9 in 2016) and median 4 (same as 2016). 48 records from Murrumbateman (BlJ1), 41 from Nicholls (LiR1) and 39 from Giralang (McD4, KaD1). Reporting rates were at their highest ever, except for summer which was marginally lower than in 2016. GBS records do not fully reflect the low presence of this species in spring reported above. No breeding, only 1 previous record in 2010 (co).
Abundance
Abundance is the average number of birds of that species per survey. Where the species was observed (presence recorded) but the number of birds seen was not recorded, this is treated as a count of zero.
Abundance by year
This chart shows the abundance of Australian White Ibis between 1982 and 2017. 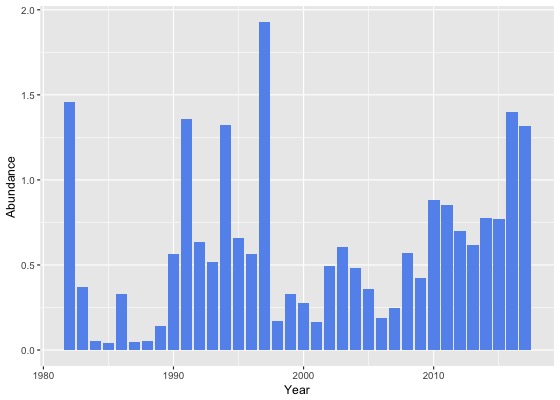
Abundance by month
This chart shows the monthly abundance of Australian White Ibis. The blue lines show the abundance for the twelve months to June 2017 and the bars show the average abundance for the period 1982 to 2017. 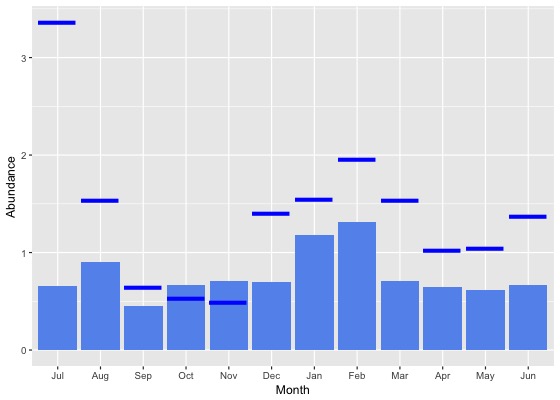
Abundance by season
This chart shows the seasonal abundance of Australian White Ibis. The blue lines show the seasonal abundance for the twelve months to June 2017 and the bars show the average seasonal abundance for the period 1982 to 2017. 
Abundance data
| Month | Season | ||||||||||||||||||
|---|---|---|---|---|---|---|---|---|---|---|---|---|---|---|---|---|---|---|---|
| Period | Jul | Aug | Sep | Oct | Nov | Dec | Jan | Feb | Mar | Apr | May | Jun | Winter | Spring | Summer | Autumn | All | ||
| All years | |||||||||||||||||||
| All | 0.7 | 0.9 | 0.5 | 0.7 | 0.7 | 0.7 | 1.2 | 1.3 | 0.7 | 0.6 | 0.6 | 0.7 | 0.7 | 0.6 | 1.0 | 0.7 | 0.8 | ||
| Previous years | |||||||||||||||||||
| All previous years | 0.2 | 0.8 | 0.4 | 0.7 | 0.7 | 0.6 | 1.1 | 1.2 | 0.6 | 0.6 | 0.5 | 0.5 | 0.5 | 0.6 | 0.9 | 0.6 | 0.7 | ||
| Previous 30 years | 0.2 | 0.8 | 0.4 | 0.7 | 0.8 | 0.6 | 1.1 | 1.2 | 0.6 | 0.6 | 0.5 | 0.5 | 0.5 | 0.6 | 0.9 | 0.6 | 0.7 | ||
| Previous 20 years | 0.2 | 1.0 | 0.5 | 0.8 | 0.8 | 0.6 | 1.1 | 1.3 | 0.6 | 0.6 | 0.5 | 0.6 | 0.6 | 0.7 | 1.0 | 0.6 | 0.7 | ||
| 10 year groups | |||||||||||||||||||
| [2007,2017) | 0.3 | 1.1 | 0.5 | 0.8 | 0.9 | 0.8 | 1.0 | 1.6 | 0.8 | 0.8 | 0.7 | 0.9 | 0.8 | 0.8 | 1.1 | 0.8 | 0.9 | ||
| [1997,2007) | 0.0 | 0.7 | 0.4 | 0.5 | 0.6 | 0.4 | 1.7 | 0.5 | 0.2 | 0.1 | 0.0 | 0.1 | 0.2 | 0.5 | 0.8 | 0.1 | 0.4 | ||
| [1987,1997) | 0.4 | 0.2 | 0.3 | 0.3 | 0.5 | 0.4 | 0.9 | 0.5 | 0.2 | 0.6 | 0.5 | 0.2 | 0.3 | 0.4 | 0.6 | 0.5 | 0.4 | ||
| 5 year groups | |||||||||||||||||||
| [2012,2017) | 0.4 | 1.3 | 0.5 | 0.9 | 1.1 | 0.8 | 0.9 | 1.5 | 0.9 | 1.0 | 0.9 | 1.3 | 1.1 | 0.8 | 1.1 | 0.9 | 1.0 | ||
| [2007,2012) | 0.0 | 0.5 | 0.6 | 0.8 | 0.5 | 0.6 | 1.4 | 2.0 | 0.7 | 0.2 | 0.1 | 0.1 | 0.1 | 0.7 | 1.2 | 0.3 | 0.6 | ||
| [2002,2007) | 0.0 | 1.1 | 0.4 | 0.5 | 0.7 | 0.5 | 1.3 | 0.4 | 0.1 | 0.1 | 0.0 | 0.1 | 0.3 | 0.5 | 0.7 | 0.1 | 0.4 | ||
| [1997,2002) | 0.0 | 0.1 | 0.3 | 0.5 | 0.5 | 0.2 | 2.2 | 0.7 | 0.3 | 0.1 | 0.1 | 0.0 | 0.1 | 0.4 | 0.9 | 0.1 | 0.4 | ||
| [1992,1997) | 0.7 | 0.3 | 0.5 | 0.6 | 0.8 | 1.0 | 2.0 | 0.9 | 0.5 | 0.9 | 0.8 | 0.2 | 0.4 | 0.6 | 1.4 | 0.7 | 0.7 | ||
| [1987,1992) | 0.2 | 0.1 | 0.3 | 0.1 | 0.4 | 0.2 | 0.4 | 0.4 | 0.1 | 0.4 | 0.4 | 0.3 | 0.2 | 0.3 | 0.3 | 0.3 | 0.3 | ||
| Year | |||||||||||||||||||
| 2017 | 3.4 | 1.5 | 0.6 | 0.5 | 0.5 | 1.4 | 1.5 | 2.0 | 1.5 | 1.0 | 1.0 | 1.4 | 1.9 | 0.6 | 1.6 | 1.2 | 1.3 | ||
| 2016 | 0.4 | 2.4 | 0.6 | 0.8 | 1.9 | 1.1 | 1.1 | 2.3 | 1.5 | 1.0 | 1.2 | 2.7 | 1.9 | 1.0 | 1.5 | 1.3 | 1.4 | ||
| 2015 | 1.0 | 1.4 | 0.4 | 0.7 | 0.7 | 1.0 | 0.8 | 0.7 | 0.4 | 0.8 | 0.4 | 1.1 | 1.2 | 0.6 | 0.8 | 0.5 | 0.8 | ||
| 2014 | 0.0 | 0.0 | 0.5 | 0.3 | 0.4 | 0.5 | 1.2 | 0.9 | 0.7 | 2.1 | 1.9 | 0.1 | 0.1 | 0.4 | 1.0 | 1.5 | 0.8 | ||
| 2013 | 0.1 | 0.1 | 0.2 | 0.7 | 0.8 | 0.3 | 0.5 | 1.7 | 0.3 | 1.1 | 0.6 | 0.9 | 0.4 | 0.6 | 0.7 | 0.7 | 0.6 | ||
| 2012 | 0.0 | 0.0 | 0.6 | 1.8 | 0.8 | 0.7 | 0.4 | 1.3 | 0.8 | 0.3 | 0.2 | 0.1 | 0.1 | 1.2 | 0.7 | 0.5 | 0.7 | ||
| 2011 | 0.0 | 1.0 | 1.8 | 1.3 | 0.1 | 1.2 | 1.0 | 2.7 | 0.7 | 0.0 | 0.1 | 0.0 | 0.2 | 1.2 | 1.5 | 0.3 | 0.8 | ||
| 2010 | 0.0 | 0.0 | 0.5 | 0.6 | 0.2 | 0.9 | 2.4 | 6.0 | 1.9 | 0.3 | 0.0 | 0.0 | 0.0 | 0.5 | 2.2 | 0.9 | 0.9 | ||
| 2009 | 0.0 | 0.5 | 0.1 | 0.8 | 0.7 | 0.2 | 1.7 | 0.6 | 0.2 | 0.0 | 0.2 | 0.0 | 0.1 | 0.6 | 0.8 | 0.1 | 0.4 | ||
| 2008 | 0.0 | 0.7 | 0.3 | 1.0 | 1.2 | 0.1 | 1.7 | 1.2 | 0.0 | 0.3 | 0.5 | 0.0 | 0.2 | 0.8 | 0.8 | 0.3 | 0.6 | ||
| 2007 | 0.0 | 0.0 | 0.2 | 0.1 | 0.2 | 0.3 | 0.7 | 0.1 | 0.3 | 0.1 | 0.0 | 0.3 | 0.2 | 0.2 | 0.4 | 0.2 | 0.2 | ||
| 2006 | 0.0 | 1.0 | 0.4 | 0.3 | 0.0 | 0.0 | 0.1 | 0.4 | 0.2 | 0.0 | 0.0 | 0.0 | 0.2 | 0.3 | 0.2 | 0.1 | 0.2 | ||
| 2005 | 0.0 | 3.9 | 1.1 | 0.0 | 0.1 | 0.1 | 0.2 | 0.2 | 0.0 | 0.0 | 0.1 | 0.0 | 0.8 | 0.5 | 0.1 | 0.0 | 0.4 | ||
| 2004 | 0.0 | 0.9 | 0.0 | 0.4 | 0.7 | 0.9 | 0.7 | 1.9 | 0.5 | 0.4 | 0.0 | 0.0 | 0.2 | 0.4 | 1.0 | 0.3 | 0.5 | ||
| 2003 | 0.0 | 0.0 | 0.3 | 2.0 | 2.2 | 0.9 | 0.3 | 0.0 | 0.0 | 0.0 | 0.0 | 0.6 | 0.2 | 1.5 | 0.5 | 0.0 | 0.6 | ||
| 2002 | 0.0 | 0.5 | 0.0 | 0.1 | 0.0 | 0.6 | 4.9 | 0.0 | 0.0 | 0.2 | 0.0 | 0.0 | 0.1 | 0.1 | 1.5 | 0.1 | 0.5 | ||
| 2001 | 0.0 | 0.0 | 0.0 | 0.5 | 0.7 | 0.0 | 0.2 | 0.1 | 0.3 | 0.1 | 0.0 | 0.0 | 0.0 | 0.3 | 0.1 | 0.2 | 0.2 | ||
| 2000 | 0.0 | 0.0 | 0.8 | 0.5 | 0.6 | 0.1 | 0.4 | 0.2 | 0.3 | 0.0 | 0.0 | 0.0 | 0.0 | 0.6 | 0.2 | 0.1 | 0.3 | ||
| 1999 | 0.0 | 0.3 | 0.2 | 0.4 | 0.0 | 0.1 | 2.4 | 0.5 | 0.2 | 0.0 | 0.0 | 0.0 | 0.1 | 0.2 | 1.0 | 0.1 | 0.3 | ||
| 1998 | 0.0 | 0.0 | 0.0 | 0.0 | 0.2 | 0.4 | 0.3 | 0.1 | 0.1 | 0.5 | 0.7 | 0.0 | 0.0 | 0.1 | 0.3 | 0.3 | 0.2 | ||
| 1997 | 0.3 | 0.4 | 0.7 | 1.7 | 0.8 | 0.9 | 20.5 | 5.1 | 0.0 | 0.1 | 0.0 | 0.0 | 0.2 | 1.0 | 6.7 | 0.0 | 1.9 | ||
| 1996 | 0.5 | 0.3 | 0.4 | 0.3 | 0.4 | 0.4 | 1.2 | 1.3 | 0.6 | 0.8 | 0.3 | 0.3 | 0.3 | 0.4 | 1.0 | 0.6 | 0.6 | ||
| 1995 | 0.8 | 0.2 | 0.2 | 0.5 | 1.1 | 1.9 | 1.0 | 0.8 | 0.6 | 0.4 | 0.4 | 0.3 | 0.4 | 0.6 | 1.2 | 0.5 | 0.7 | ||
| 1994 | 0.9 | 0.6 | 0.2 | 1.5 | 0.7 | 2.6 | 6.9 | 0.3 | 0.6 | 1.7 | 0.9 | 0.2 | 0.5 | 0.8 | 3.5 | 1.1 | 1.3 | ||
| 1993 | 0.1 | 0.0 | 0.0 | 0.4 | 1.0 | 0.0 | 0.1 | 1.5 | 0.0 | 1.1 | 1.8 | 0.2 | 0.1 | 0.5 | 0.4 | 0.9 | 0.5 | ||
| 1992 | 1.3 | 0.2 | 1.3 | 0.6 | 0.7 | 0.1 | 1.1 | 0.7 | 0.5 | 0.4 | 0.6 | 0.0 | 0.5 | 0.8 | 0.6 | 0.5 | 0.6 | ||
| 1991 | 0.4 | 0.3 | 2.4 | 0.2 | 4.4 | 0.3 | 3.3 | 3.6 | 0.2 | 0.6 | 0.3 | 1.3 | 0.5 | 2.3 | 2.1 | 0.3 | 1.4 | ||
| 1990 | 0.0 | 0.3 | 0.0 | 0.1 | 0.0 | 1.0 | 0.6 | 0.6 | 0.5 | 2.5 | 2.0 | 0.5 | 0.2 | 0.0 | 0.7 | 1.6 | 0.6 | ||
| 1989 | 0.5 | 0.0 | 0.0 | 0.0 | 0.1 | 0.0 | 0.1 | 0.1 | 0.0 | 0.1 | 0.7 | 0.1 | 0.2 | 0.0 | 0.1 | 0.3 | 0.1 | ||
| 1988 | 0.0 | 0.0 | 0.1 | 0.0 | 0.0 | 0.1 | 0.0 | 0.1 | 0.0 | 0.0 | 0.0 | 0.2 | 0.1 | 0.0 | 0.1 | 0.0 | 0.1 | ||
| 1987 | 0.0 | 0.0 | 0.0 | 0.0 | 0.0 | 0.0 | 0.1 | 0.1 | 0.1 | 0.1 | 0.0 | 0.1 | 0.1 | 0.0 | 0.1 | 0.1 | 0.0 | ||
| 1986 | 0.0 | 1.3 | 0.0 | 1.4 | 0.1 | 0.0 | 0.0 | 0.3 | 0.2 | 0.5 | 0.0 | 0.0 | 0.5 | 0.4 | 0.1 | 0.3 | 0.3 | ||
| 1985 | 0.0 | 0.1 | 0.0 | 0.0 | 0.0 | 0.1 | 0.5 | 0.3 | 0.0 | 0.0 | 0.1 | 0.0 | 0.0 | 0.0 | 0.2 | 0.0 | 0.0 | ||
| 1984 | 0.0 | 0.3 | 0.0 | 0.2 | 0.0 | 0.0 | 0.0 | 0.0 | 0.0 | 0.0 | 0.1 | 0.1 | 0.1 | 0.1 | 0.0 | 0.1 | 0.1 | ||
| 1983 | 0.5 | 0.1 | 0.2 | 0.4 | 0.8 | 0.3 | 1.0 | 0.6 | 0.0 | - | 0.2 | 0.0 | 0.1 | 0.5 | 0.6 | 0.2 | 0.4 | ||
| 1982 | - | 0.4 | - | 0.0 | 0.1 | 1.9 | - | 2.4 | - | 2.9 | - | 0.7 | 0.6 | 0.1 | 2.1 | 2.9 | 1.5 | ||
Reporting rates
Reporting rate is the proportion of all surveys in which the species was present.
Reporting rate by year
This chart shows the reporting rate of Australian White Ibis each year between 1982 and 2017. 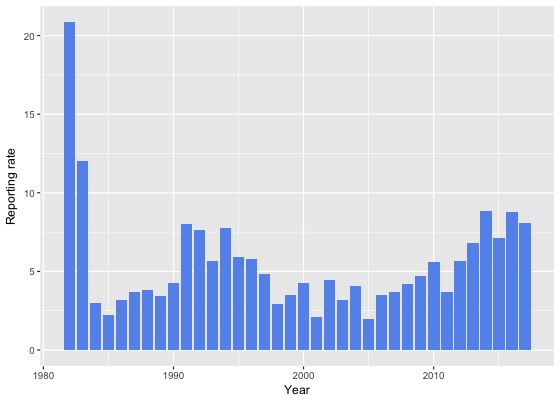
Reporting rate by month
This chart shows the reporting rate by month of Australian White Ibis. The blue lines show the reporting rate for the twelve months to June 2017 and the bars show the average reporting rate for the period 1982 to 2017. 
Reporting rate by season
This chart shows the seasonal reporting rate of Australian White Ibis. The blue lines show the seasonal reporting rate for the twelve months to June 2017 and the bars show the average seasonal reporting rate for the period 1982 to 2017. 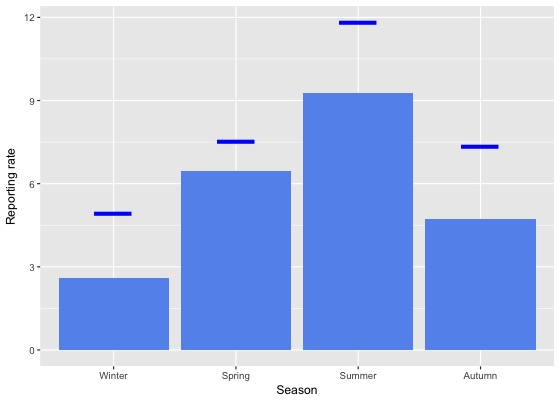
Reporting rate data
| Month | Season | ||||||||||||||||||
|---|---|---|---|---|---|---|---|---|---|---|---|---|---|---|---|---|---|---|---|
| Period | Jul | Aug | Sep | Oct | Nov | Dec | Jan | Feb | Mar | Apr | May | Jun | Winter | Spring | Summer | Autumn | All | ||
| All years | |||||||||||||||||||
| All | 2.3 | 3.7 | 4.3 | 6.6 | 8.7 | 7.5 | 10.8 | 9.5 | 6.0 | 4.6 | 3.0 | 2.0 | 2.6 | 6.5 | 9.3 | 4.7 | 6.0 | ||
| Previous years | |||||||||||||||||||
| All previous years | 1.7 | 3.2 | 3.9 | 6.4 | 8.8 | 7.4 | 10.2 | 8.7 | 5.3 | 4.1 | 2.8 | 1.7 | 2.2 | 6.3 | 8.8 | 4.2 | 5.6 | ||
| Previous 30 years | 1.7 | 3.2 | 4.0 | 6.5 | 8.9 | 7.5 | 10.3 | 8.8 | 5.3 | 4.0 | 2.8 | 1.7 | 2.1 | 6.4 | 8.8 | 4.2 | 5.6 | ||
| Previous 20 years | 1.4 | 3.4 | 4.0 | 6.8 | 10.0 | 7.7 | 10.8 | 9.0 | 5.3 | 3.5 | 2.4 | 1.3 | 1.9 | 6.7 | 9.2 | 3.9 | 5.8 | ||
| 10 year groups | |||||||||||||||||||
| [2007,2017) | 1.8 | 3.5 | 5.0 | 7.4 | 12.8 | 9.4 | 11.4 | 10.3 | 6.3 | 4.0 | 2.9 | 1.7 | 2.2 | 8.0 | 10.5 | 4.6 | 6.7 | ||
| [1997,2007) | 0.7 | 3.1 | 1.8 | 4.9 | 4.3 | 4.4 | 8.7 | 5.6 | 3.0 | 2.2 | 1.4 | 0.6 | 1.3 | 3.6 | 6.0 | 2.4 | 3.4 | ||
| [1987,1997) | 2.9 | 2.6 | 4.0 | 4.2 | 5.5 | 6.1 | 7.2 | 7.5 | 5.8 | 6.6 | 4.0 | 3.4 | 2.9 | 4.6 | 6.9 | 5.5 | 4.9 | ||
| 5 year groups | |||||||||||||||||||
| [2012,2017) | 2.3 | 3.7 | 5.6 | 8.5 | 14.5 | 10.7 | 12.1 | 10.9 | 7.3 | 5.2 | 3.5 | 2.3 | 2.8 | 9.1 | 11.3 | 5.6 | 7.7 | ||
| [2007,2012) | 0.5 | 2.7 | 3.8 | 5.5 | 7.9 | 6.7 | 9.0 | 7.9 | 3.6 | 1.3 | 0.9 | 0.4 | 1.0 | 5.5 | 7.8 | 2.1 | 4.3 | ||
| [2002,2007) | 0.7 | 3.7 | 1.6 | 5.4 | 4.3 | 4.7 | 8.6 | 5.2 | 3.2 | 2.4 | 1.5 | 0.5 | 1.4 | 3.7 | 6.0 | 2.5 | 3.4 | ||
| [1997,2002) | 0.8 | 2.5 | 2.1 | 4.3 | 4.4 | 4.0 | 8.9 | 6.0 | 2.8 | 1.9 | 1.3 | 0.8 | 1.3 | 3.5 | 6.1 | 2.1 | 3.4 | ||
| [1992,1997) | 5.2 | 3.9 | 4.6 | 6.4 | 7.9 | 8.2 | 9.0 | 7.9 | 7.7 | 7.5 | 6.5 | 3.3 | 4.1 | 6.4 | 8.4 | 7.3 | 6.5 | ||
| [1987,1992) | 1.8 | 1.9 | 3.7 | 3.1 | 4.3 | 5.1 | 6.2 | 7.4 | 4.7 | 6.0 | 2.7 | 3.4 | 2.3 | 3.7 | 6.2 | 4.5 | 4.2 | ||
| Year | |||||||||||||||||||
| 2017 | 6.1 | 6.1 | 7.0 | 7.7 | 7.8 | 7.9 | 13.7 | 13.2 | 9.6 | 8.0 | 4.1 | 3.4 | 4.9 | 7.5 | 11.8 | 7.4 | 8.1 | ||
| 2016 | 2.0 | 4.9 | 8.8 | 12.9 | 20.3 | 11.4 | 11.5 | 10.3 | 8.2 | 5.5 | 3.0 | 2.7 | 3.3 | 13.5 | 11.0 | 5.9 | 8.8 | ||
| 2015 | 4.0 | 4.5 | 3.7 | 8.5 | 13.0 | 12.3 | 10.5 | 10.8 | 7.5 | 3.8 | 1.2 | 1.9 | 3.2 | 8.3 | 11.1 | 4.5 | 7.1 | ||
| 2014 | 1.2 | 2.5 | 4.9 | 6.4 | 8.9 | 13.4 | 18.1 | 13.3 | 9.1 | 6.9 | 5.9 | 2.9 | 2.4 | 6.5 | 15.7 | 7.6 | 8.9 | ||
| 2013 | 1.8 | 3.6 | 3.4 | 5.2 | 13.3 | 7.7 | 10.4 | 11.1 | 5.7 | 6.5 | 4.6 | 2.5 | 2.6 | 6.9 | 9.5 | 5.8 | 6.8 | ||
| 2012 | 1.2 | 0.0 | 3.9 | 5.4 | 10.1 | 8.6 | 10.1 | 9.8 | 2.7 | 3.9 | 8.0 | 1.5 | 1.0 | 6.1 | 9.5 | 4.3 | 5.6 | ||
| 2011 | 2.4 | 0.8 | 2.7 | 4.2 | 5.5 | 6.2 | 8.0 | 6.4 | 5.0 | 0.3 | 0.7 | 0.3 | 0.8 | 4.0 | 6.9 | 2.1 | 3.7 | ||
| 2010 | 0.0 | 1.8 | 8.2 | 6.3 | 8.6 | 11.3 | 11.6 | 10.6 | 2.0 | 0.9 | 0.0 | 0.4 | 0.6 | 7.4 | 11.3 | 1.2 | 5.6 | ||
| 2009 | 0.0 | 6.2 | 1.5 | 5.0 | 10.7 | 4.8 | 12.0 | 10.8 | 5.6 | 0.8 | 3.1 | 0.0 | 1.3 | 5.3 | 8.7 | 3.1 | 4.7 | ||
| 2008 | 0.0 | 4.3 | 5.2 | 5.8 | 4.0 | 5.4 | 9.5 | 9.3 | 2.2 | 1.9 | 0.9 | 1.4 | 1.7 | 5.4 | 7.5 | 1.8 | 4.2 | ||
| 2007 | 0.0 | 0.9 | 1.2 | 6.1 | 9.5 | 5.0 | 6.3 | 4.3 | 3.0 | 2.6 | 0.0 | 0.3 | 0.4 | 5.3 | 5.4 | 2.2 | 3.7 | ||
| 2006 | 0.7 | 5.8 | 1.3 | 3.3 | 2.4 | 1.7 | 7.3 | 11.1 | 5.0 | 3.2 | 2.9 | 0.4 | 1.6 | 2.5 | 6.3 | 4.1 | 3.5 | ||
| 2005 | 0.0 | 4.7 | 1.5 | 1.1 | 3.4 | 2.0 | 4.3 | 6.5 | 1.3 | 2.2 | 1.5 | 0.4 | 1.2 | 1.8 | 3.5 | 1.6 | 2.0 | ||
| 2004 | 0.8 | 4.6 | 2.4 | 5.2 | 7.0 | 5.1 | 6.7 | 8.1 | 6.2 | 3.3 | 1.0 | 0.6 | 1.8 | 4.7 | 6.2 | 4.0 | 4.1 | ||
| 2003 | 0.9 | 1.4 | 1.3 | 10.9 | 6.0 | 5.5 | 5.9 | 1.1 | 1.3 | 0.0 | 0.8 | 1.2 | 1.2 | 5.7 | 4.2 | 0.7 | 3.2 | ||
| 2002 | 1.1 | 2.5 | 1.5 | 7.7 | 2.5 | 7.7 | 18.2 | 2.0 | 1.8 | 3.6 | 1.2 | 0.0 | 1.0 | 4.1 | 8.9 | 2.3 | 4.5 | ||
| 2001 | 0.4 | 1.2 | 0.3 | 2.9 | 3.4 | 2.9 | 7.0 | 3.6 | 2.1 | 1.5 | 1.2 | 0.0 | 0.5 | 1.9 | 4.3 | 1.7 | 2.1 | ||
| 2000 | 0.0 | 3.9 | 3.3 | 6.6 | 6.9 | 2.7 | 9.1 | 7.1 | 3.3 | 1.8 | 0.9 | 1.6 | 1.9 | 5.6 | 6.0 | 2.2 | 4.2 | ||
| 1999 | 2.9 | 2.1 | 2.3 | 4.4 | 1.3 | 5.0 | 11.7 | 5.0 | 4.3 | 2.1 | 1.7 | 0.9 | 1.4 | 2.7 | 7.1 | 2.7 | 3.5 | ||
| 1998 | 0.0 | 0.0 | 1.6 | 1.1 | 3.5 | 5.7 | 7.4 | 7.5 | 2.2 | 2.6 | 3.7 | 0.0 | 0.0 | 2.1 | 6.6 | 2.5 | 3.0 | ||
| 1997 | 2.3 | 5.2 | 5.5 | 5.3 | 6.0 | 7.7 | 9.8 | 10.5 | 0.0 | 2.8 | 0.0 | 1.4 | 2.8 | 5.6 | 9.0 | 1.5 | 4.9 | ||
| 1996 | 1.5 | 4.3 | 4.0 | 4.4 | 6.5 | 10.1 | 6.8 | 7.1 | 5.9 | 10.9 | 3.4 | 3.4 | 3.2 | 5.1 | 8.0 | 6.7 | 5.8 | ||
| 1995 | 6.5 | 3.9 | 1.9 | 6.1 | 4.5 | 10.3 | 8.8 | 7.9 | 8.2 | 6.5 | 6.5 | 1.1 | 3.8 | 4.5 | 9.1 | 7.0 | 5.9 | ||
| 1994 | 3.9 | 7.8 | 5.9 | 9.3 | 8.8 | 10.9 | 13.2 | 5.2 | 12.5 | 7.6 | 5.0 | 2.2 | 4.6 | 8.3 | 9.9 | 8.4 | 7.8 | ||
| 1993 | 4.1 | 1.3 | 1.6 | 5.3 | 13.6 | 2.2 | 4.1 | 9.4 | 0.0 | 5.0 | 14.3 | 7.2 | 4.1 | 6.9 | 4.7 | 6.4 | 5.6 | ||
| 1992 | 9.2 | 1.9 | 9.4 | 7.4 | 8.3 | 4.8 | 12.1 | 12.2 | 12.7 | 8.5 | 2.6 | 3.3 | 5.0 | 8.4 | 9.3 | 7.8 | 7.6 | ||
| 1991 | 1.6 | 1.1 | 3.5 | 6.8 | 15.5 | 8.1 | 21.4 | 16.0 | 6.3 | 13.6 | 8.2 | 6.0 | 2.2 | 8.7 | 14.4 | 9.3 | 8.0 | ||
| 1990 | 0.6 | 1.1 | 0.0 | 3.1 | 3.7 | 12.5 | 6.9 | 8.5 | 9.1 | 7.1 | 4.1 | 3.9 | 1.4 | 2.3 | 9.3 | 6.9 | 4.3 | ||
| 1989 | 2.6 | 1.7 | 3.5 | 2.7 | 6.1 | 3.0 | 5.3 | 7.7 | 2.8 | 3.1 | 1.3 | 1.2 | 1.8 | 3.9 | 5.2 | 2.5 | 3.4 | ||
| 1988 | 2.2 | 3.0 | 5.1 | 2.3 | 4.2 | 5.1 | 3.5 | 7.4 | 4.5 | 4.3 | 2.0 | 3.9 | 3.0 | 3.7 | 5.3 | 3.6 | 3.8 | ||
| 1987 | 0.0 | 0.0 | 4.5 | 2.7 | 0.3 | 3.8 | 5.1 | 5.0 | 4.3 | 7.4 | 2.2 | 3.9 | 3.5 | 2.3 | 4.6 | 4.7 | 3.7 | ||
| 1986 | 0.0 | 2.6 | 1.9 | 8.3 | 2.1 | 0.0 | 0.0 | 8.3 | 3.2 | 5.9 | 0.0 | 2.9 | 2.0 | 3.7 | 3.2 | 3.6 | 3.2 | ||
| 1985 | 0.0 | 3.3 | 0.0 | 0.0 | 0.0 | 3.3 | 37.5 | 11.8 | 0.0 | 0.0 | 10.0 | 0.0 | 1.1 | 0.0 | 8.2 | 2.5 | 2.2 | ||
| 1984 | 0.0 | 10.0 | 0.0 | 8.3 | 0.0 | 0.0 | 0.0 | 0.0 | 3.7 | 2.9 | 6.5 | 2.9 | 4.1 | 4.8 | 0.0 | 4.3 | 3.0 | ||
| 1983 | 16.7 | 8.3 | 20.0 | 15.4 | 11.1 | 15.4 | 16.7 | 18.2 | 0.0 | - | 8.3 | 0.0 | 6.9 | 14.8 | 16.7 | 7.1 | 12.0 | ||
| 1982 | - | 9.1 | - | 0.0 | 12.5 | 28.6 | - | 18.2 | - | 30.8 | - | 21.4 | 16.0 | 11.1 | 24.0 | 30.8 | 20.8 | ||
Breeding data
Breeding records by month
Number of breeding records by breeding code and month, 2017 and all years| Breeding code | Jul | Aug | Sep | Oct | Nov | Dec | Jan | Feb | Mar | Apr | May | Jun |
|---|---|---|---|---|---|---|---|---|---|---|---|---|
| 2017 | ||||||||||||
| Breeding (BLA code) | 0 | 0 | 0 | 0 | 0 | 0 | 0 | 0 | 0 | 0 | 0 | 0 |
| Carrying Food | 0 | 0 | 0 | 0 | 0 | 0 | 0 | 0 | 0 | 0 | 0 | 0 |
| Copulating | 0 | 0 | 0 | 0 | 0 | 0 | 0 | 0 | 0 | 0 | 0 | 0 |
| Display | 0 | 0 | 0 | 0 | 0 | 0 | 0 | 0 | 0 | 0 | 0 | 0 |
| Dependent young | 0 | 0 | 0 | 0 | 0 | 0 | 0 | 0 | 0 | 0 | 0 | 0 |
| Faecal sac | 0 | 0 | 0 | 0 | 0 | 0 | 0 | 0 | 0 | 0 | 0 | 0 |
| Inspecting hollow | 0 | 0 | 0 | 0 | 0 | 0 | 0 | 0 | 0 | 0 | 0 | 0 |
| Nest building | 0 | 0 | 0 | 0 | 0 | 0 | 0 | 0 | 0 | 0 | 0 | 0 |
| Nest with eggs | 0 | 0 | 0 | 0 | 0 | 0 | 0 | 0 | 0 | 0 | 0 | 0 |
| Nest with young | 0 | 0 | 1 | 0 | 0 | 0 | 0 | 0 | 0 | 0 | 0 | 0 |
| On/leaving nest | 0 | 0 | 1 | 1 | 0 | 1 | 0 | 0 | 0 | 0 | 0 | 0 |
| All years | ||||||||||||
| Breeding (BLA code) | 0 | 1 | 1 | 0 | 2 | 3 | 2 | 0 | 0 | 0 | 0 | 0 |
| Carrying Food | 0 | 0 | 0 | 1 | 0 | 0 | 0 | 0 | 0 | 0 | 0 | 0 |
| Copulating | 0 | 0 | 0 | 1 | 0 | 0 | 0 | 0 | 0 | 0 | 0 | 0 |
| Display | 0 | 0 | 0 | 0 | 0 | 0 | 0 | 0 | 0 | 0 | 0 | 0 |
| Dependent young | 0 | 0 | 0 | 0 | 0 | 0 | 1 | 1 | 0 | 1 | 0 | 0 |
| Faecal sac | 0 | 0 | 0 | 0 | 0 | 0 | 0 | 0 | 0 | 0 | 0 | 0 |
| Inspecting hollow | 0 | 0 | 0 | 0 | 0 | 0 | 0 | 0 | 0 | 0 | 0 | 0 |
| Nest building | 0 | 0 | 0 | 1 | 0 | 0 | 0 | 0 | 0 | 0 | 0 | 0 |
| Nest with eggs | 0 | 1 | 1 | 1 | 1 | 0 | 0 | 0 | 0 | 0 | 0 | 0 |
| Nest with young | 0 | 0 | 3 | 5 | 2 | 1 | 2 | 2 | 3 | 0 | 0 | 0 |
| On/leaving nest | 0 | 0 | 3 | 4 | 2 | 4 | 2 | 2 | 0 | 0 | 0 | 0 |
Breeding records by year
Average number of breeding records per period by breeding code| Period | Breeding (BLA code) | Carrying Food | Copulating | Display | Dependent young | Faecal sac | Inspecting hollow | Nest building | Nest with eggs | Nest with young | On/leaving nest |
|---|---|---|---|---|---|---|---|---|---|---|---|
| All years | |||||||||||
| All | 0.2 | 0.0 | 0.0 | 0.0 | 0.1 | 0.0 | 0.0 | 0.0 | 0.1 | 0.5 | 0.5 |
| Previous years | |||||||||||
| All previous years | 0.3 | 0.0 | 0.0 | 0.0 | 0.1 | 0.0 | 0.0 | 0.0 | 0.1 | 0.5 | 0.4 |
| Previous 30 years | 0.3 | 0.0 | 0.0 | 0.0 | 0.1 | 0.0 | 0.0 | 0.0 | 0.1 | 0.6 | 0.5 |
| Previous 20 years | 0.5 | 0.0 | 0.0 | 0.0 | 0.1 | 0.0 | 0.0 | 0.0 | 0.2 | 0.8 | 0.5 |
| 10 year groups | |||||||||||
| [2007,2017) | 0.1 | 0.1 | 0.1 | 0.0 | 0.1 | 0.0 | 0.0 | 0.1 | 0.3 | 1.4 | 0.6 |
| [1997,2007) | 0.8 | 0.0 | 0.0 | 0.0 | 0.2 | 0.0 | 0.0 | 0.0 | 0.1 | 0.1 | 0.4 |
| [1987,1997) | 0.0 | 0.0 | 0.0 | 0.0 | 0.0 | 0.0 | 0.0 | 0.0 | 0.0 | 0.2 | 0.4 |
| 5 year groups | |||||||||||
| [2012,2017) | 0.0 | 0.0 | 0.2 | 0.0 | 0.0 | 0.0 | 0.0 | 0.0 | 0.0 | 0.2 | 0.0 |
| [2007,2012) | 0.2 | 0.2 | 0.0 | 0.0 | 0.2 | 0.0 | 0.0 | 0.2 | 0.6 | 2.6 | 1.2 |
| [2002,2007) | 0.0 | 0.0 | 0.0 | 0.0 | 0.0 | 0.0 | 0.0 | 0.0 | 0.0 | 0.2 | 0.2 |
| [1997,2002) | 1.6 | 0.0 | 0.0 | 0.0 | 0.4 | 0.0 | 0.0 | 0.0 | 0.2 | 0.0 | 0.6 |
| [1992,1997) | 0.0 | 0.0 | 0.0 | 0.0 | 0.0 | 0.0 | 0.0 | 0.0 | 0.0 | 0.2 | 0.8 |
| [1987,1992) | 0.0 | 0.0 | 0.0 | 0.0 | 0.0 | 0.0 | 0.0 | 0.0 | 0.0 | 0.2 | 0.0 |
| Year | |||||||||||
| 2017 | 0.0 | 0.0 | 0.0 | 0.0 | 0.0 | 0.0 | 0.0 | 0.0 | 0.0 | 1.0 | 3.0 |
| 2016 | 0.0 | 0.0 | 0.0 | 0.0 | 0.0 | 0.0 | 0.0 | 0.0 | 0.0 | 1.0 | 0.0 |
| 2015 | 0.0 | 0.0 | 1.0 | 0.0 | 0.0 | 0.0 | 0.0 | 0.0 | 0.0 | 0.0 | 0.0 |
| 2014 | 0.0 | 0.0 | 0.0 | 0.0 | 0.0 | 0.0 | 0.0 | 0.0 | 0.0 | 0.0 | 0.0 |
| 2013 | 0.0 | 0.0 | 0.0 | 0.0 | 0.0 | 0.0 | 0.0 | 0.0 | 0.0 | 0.0 | 0.0 |
| 2012 | 0.0 | 0.0 | 0.0 | 0.0 | 0.0 | 0.0 | 0.0 | 0.0 | 0.0 | 0.0 | 0.0 |
| 2011 | 0.0 | 0.0 | 0.0 | 0.0 | 0.0 | 0.0 | 0.0 | 0.0 | 2.0 | 4.0 | 4.0 |
| 2010 | 0.0 | 0.0 | 0.0 | 0.0 | 1.0 | 0.0 | 0.0 | 0.0 | 1.0 | 4.0 | 2.0 |
| 2009 | 1.0 | 1.0 | 0.0 | 0.0 | 0.0 | 0.0 | 0.0 | 0.0 | 0.0 | 2.0 | 0.0 |
| 2008 | 0.0 | 0.0 | 0.0 | 0.0 | 0.0 | 0.0 | 0.0 | 1.0 | 0.0 | 2.0 | 0.0 |
| 2007 | 0.0 | 0.0 | 0.0 | 0.0 | 0.0 | 0.0 | 0.0 | 0.0 | 0.0 | 1.0 | 0.0 |
| 2006 | 0.0 | 0.0 | 0.0 | 0.0 | 0.0 | 0.0 | 0.0 | 0.0 | 0.0 | 1.0 | 0.0 |
| 2005 | 0.0 | 0.0 | 0.0 | 0.0 | 0.0 | 0.0 | 0.0 | 0.0 | 0.0 | 0.0 | 0.0 |
| 2004 | 0.0 | 0.0 | 0.0 | 0.0 | 0.0 | 0.0 | 0.0 | 0.0 | 0.0 | 0.0 | 1.0 |
| 2003 | 0.0 | 0.0 | 0.0 | 0.0 | 0.0 | 0.0 | 0.0 | 0.0 | 0.0 | 0.0 | 0.0 |
| 2002 | 0.0 | 0.0 | 0.0 | 0.0 | 0.0 | 0.0 | 0.0 | 0.0 | 0.0 | 0.0 | 0.0 |
| 2001 | 3.0 | 0.0 | 0.0 | 0.0 | 0.0 | 0.0 | 0.0 | 0.0 | 1.0 | 0.0 | 0.0 |
| 2000 | 2.0 | 0.0 | 0.0 | 0.0 | 0.0 | 0.0 | 0.0 | 0.0 | 0.0 | 0.0 | 0.0 |
| 1999 | 1.0 | 0.0 | 0.0 | 0.0 | 1.0 | 0.0 | 0.0 | 0.0 | 0.0 | 0.0 | 0.0 |
| 1998 | 0.0 | 0.0 | 0.0 | 0.0 | 1.0 | 0.0 | 0.0 | 0.0 | 0.0 | 0.0 | 1.0 |
| 1997 | 2.0 | 0.0 | 0.0 | 0.0 | 0.0 | 0.0 | 0.0 | 0.0 | 0.0 | 0.0 | 2.0 |
| 1996 | 0.0 | 0.0 | 0.0 | 0.0 | 0.0 | 0.0 | 0.0 | 0.0 | 0.0 | 0.0 | 0.0 |
| 1995 | 0.0 | 0.0 | 0.0 | 0.0 | 0.0 | 0.0 | 0.0 | 0.0 | 0.0 | 0.0 | 0.0 |
| 1994 | 0.0 | 0.0 | 0.0 | 0.0 | 0.0 | 0.0 | 0.0 | 0.0 | 0.0 | 0.0 | 2.0 |
| 1993 | 0.0 | 0.0 | 0.0 | 0.0 | 0.0 | 0.0 | 0.0 | 0.0 | 0.0 | 0.0 | 1.0 |
| 1992 | 0.0 | 0.0 | 0.0 | 0.0 | 0.0 | 0.0 | 0.0 | 0.0 | 0.0 | 1.0 | 1.0 |
| 1991 | 0.0 | 0.0 | 0.0 | 0.0 | 0.0 | 0.0 | 0.0 | 0.0 | 0.0 | 1.0 | 0.0 |
| 1990 | 0.0 | 0.0 | 0.0 | 0.0 | 0.0 | 0.0 | 0.0 | 0.0 | 0.0 | 0.0 | 0.0 |
| 1989 | 0.0 | 0.0 | 0.0 | 0.0 | 0.0 | 0.0 | 0.0 | 0.0 | 0.0 | 0.0 | 0.0 |
| 1988 | 0.0 | 0.0 | 0.0 | 0.0 | 0.0 | 0.0 | 0.0 | 0.0 | 0.0 | 0.0 | 0.0 |
| 1987 | 0.0 | 0.0 | 0.0 | 0.0 | 0.0 | 0.0 | 0.0 | 0.0 | 0.0 | 0.0 | 0.0 |
| 1986 | 0.0 | 0.0 | 0.0 | 0.0 | 0.0 | 0.0 | 0.0 | 0.0 | 0.0 | 0.0 | 0.0 |
| 1985 | 0.0 | 0.0 | 0.0 | 0.0 | 0.0 | 0.0 | 0.0 | 0.0 | 0.0 | 0.0 | 0.0 |
| 1984 | 0.0 | 0.0 | 0.0 | 0.0 | 0.0 | 0.0 | 0.0 | 0.0 | 0.0 | 0.0 | 0.0 |
| 1983 | 0.0 | 0.0 | 0.0 | 0.0 | 0.0 | 0.0 | 0.0 | 0.0 | 0.0 | 0.0 | 0.0 |
| 1982 | 0.0 | 0.0 | 0.0 | 0.0 | 0.0 | 0.0 | 0.0 | 0.0 | 0.0 | 0.0 | 0.0 |
Distribution map
Distribution - 2017
This map shows the observed distribution of the Australian White Ibis for 2017.
The red circles are the grid cells where Australian White Ibis have been reported.
The transparency of the red circles indicate how many surveys sheets were submitted for that grid cell; the darker the red the more reliable the data. Of the 315 grid cells with reports, 83 had only one sheet; an example is grid number N11.
The size of the circle represents the reporting rate. The maximum reporting rate for Australian White Ibis was 100.0% (eg grid number N11) and the minimum was 0.5% (eg grid number K15). 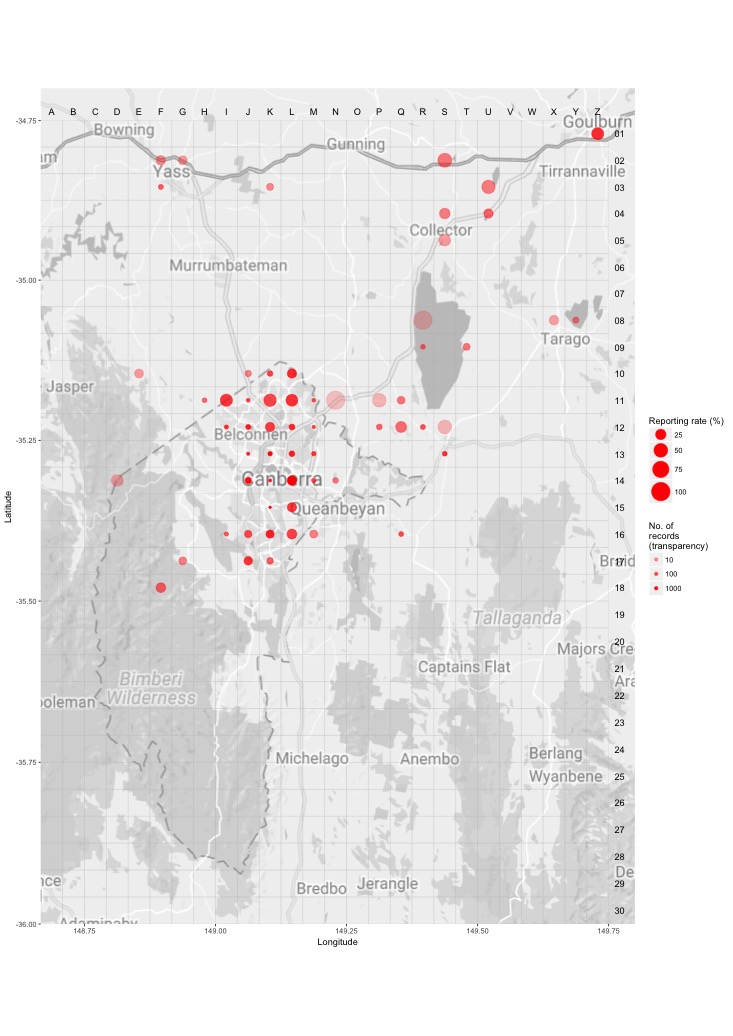
Distribution - all years
This map shows the observed distribution of the Australian White Ibis for all years.
The red circles are the grid cells where Australian White Ibis have been reported.
The transparency of the red circles indicate how many surveys sheets were submitted for that grid cell; the darker the red the more reliable the data. Of the 703 grid cells with reports, 55 had only one sheet; an example is grid number A12.
The size of the circle represents the reporting rate. The maximum reporting rate for Australian White Ibis was 64.7% (eg grid number S2) and the minimum was 0.1% (eg grid number I15). 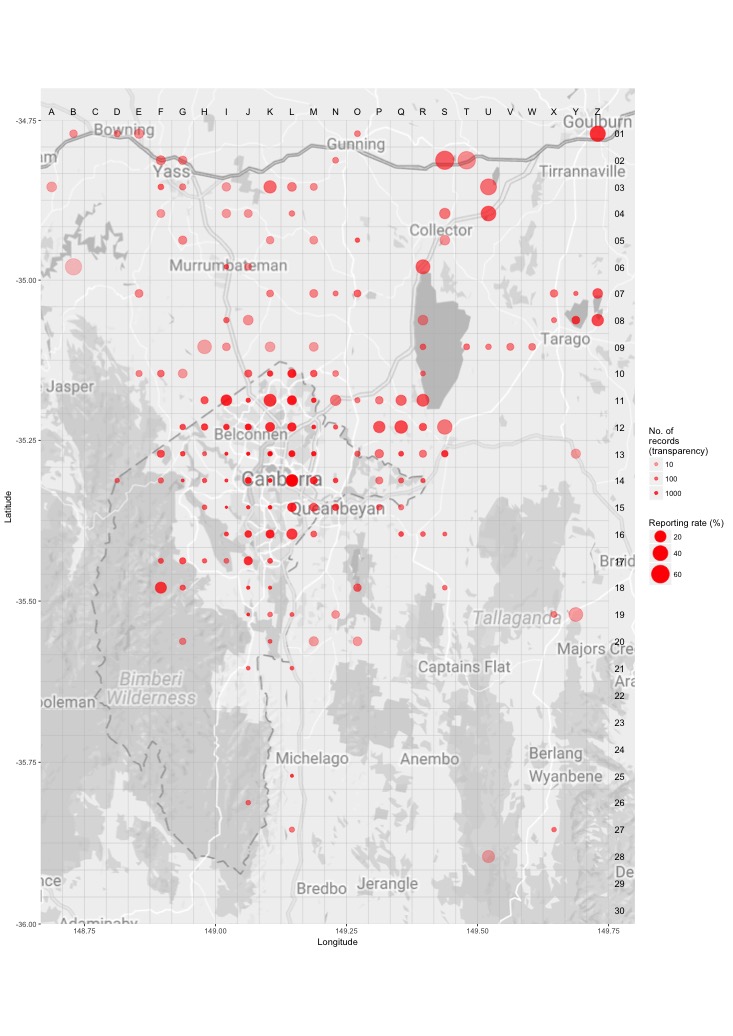
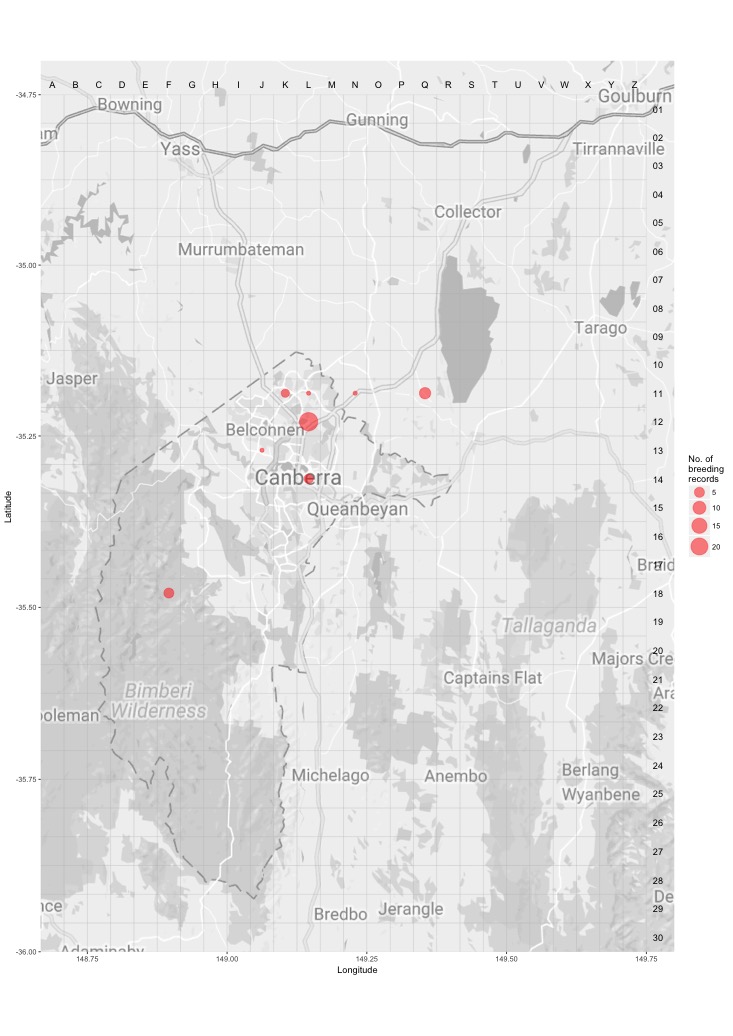
Breeding map
Breeding - 2017
This map shows the breeding distribution of the Australian White Ibis for 2017.
The red circles are the grid cells where breeding activity for Australian White Ibis have been reported.
The size of the circle represents the number of reports. 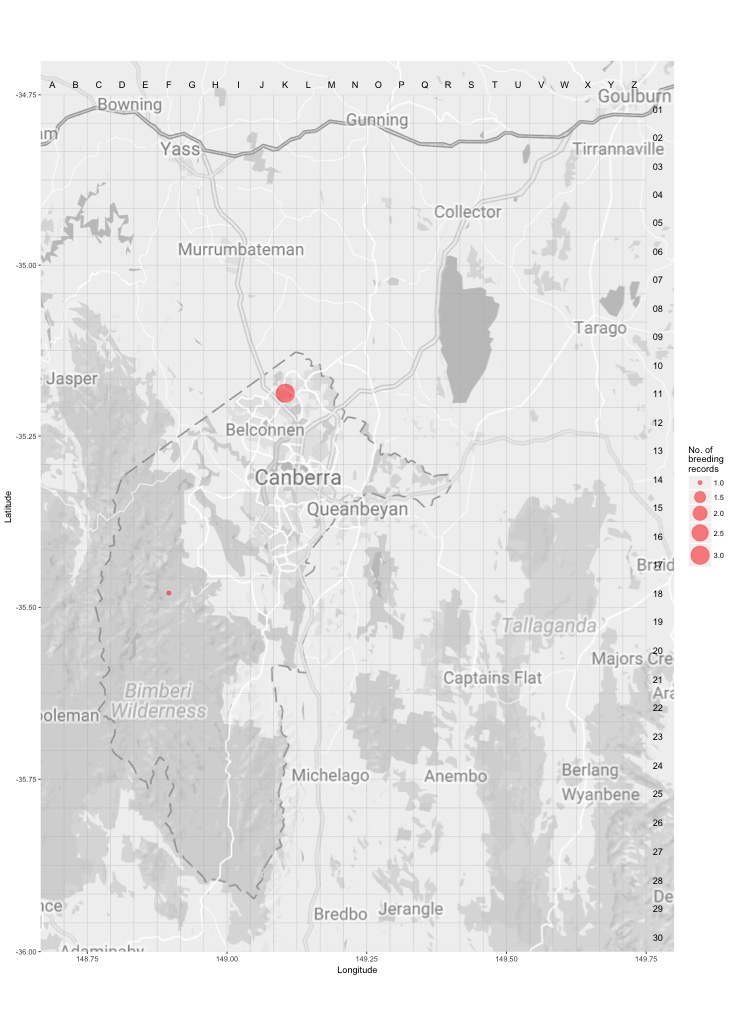
Breeding - all years
This map shows the breeding distribution of the Australian White Ibis for all years.
The red circles are the grid cells where breeding activity for Australian White Ibis have been reported.
The size of the circle represents the number of reports.